Stock Portfolio
These demos showcase different components of Connect. Each folder contains a piece of R content. More details on each are below. If you have an Internet connect, you can pull live data using the tidyquant and quantmod packages. If you want encapsulated external dependencies, there are two SQLite databases with sample data: stock.db and portfolio.db.
Stocks Report
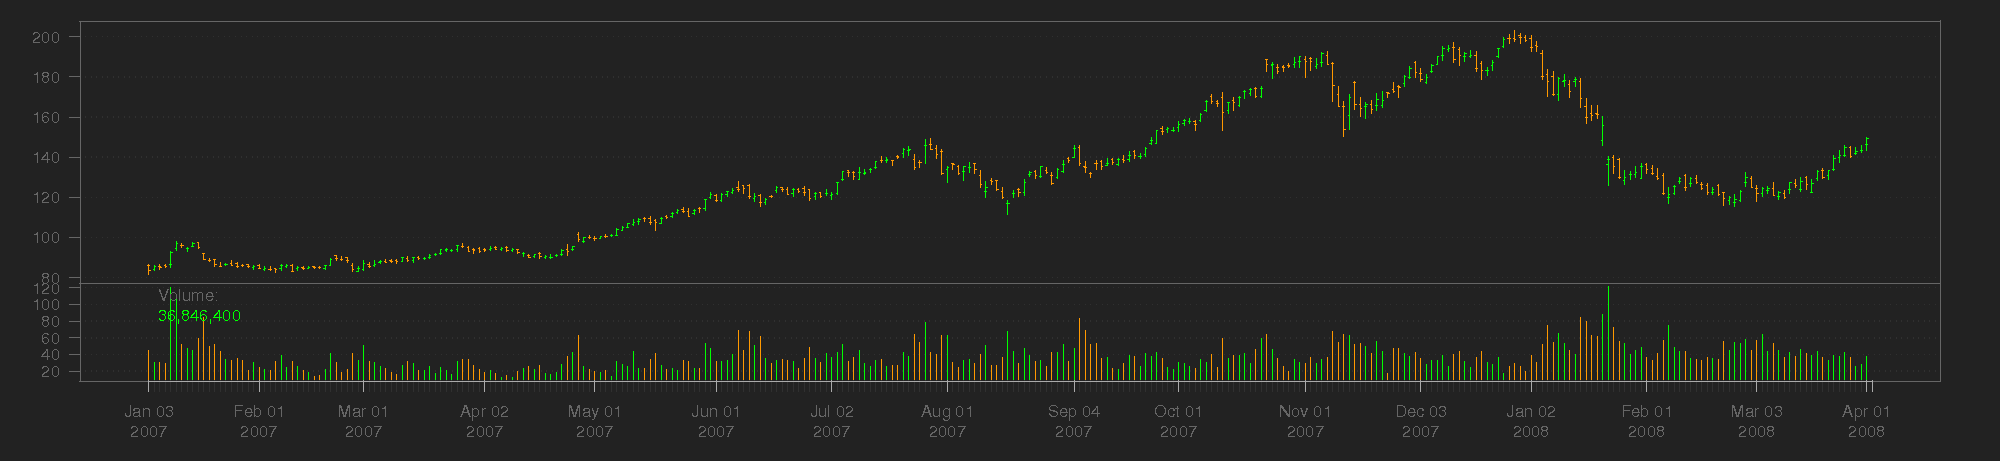
- Stocks report [login]. Summarize a specific stock ticker symbol. The R Markdown report is parameterized, making it easy to schedule different versions of the report in Connect. The report also generates an email that includes a custom subject line, embeds a plot and table in the body of the email, and attaches a summary of the data in a csv file. Connect stores the history of the report and makes it easy to compare versions of the report over time.
Stocks Portfolio
ETL [login]. Schedule an ETL task that updates a database. The ETL document provides a quick visualization to validate the model over time and Connect sends an email if the ETL task fails. The output data from this ETL is used for the following app, report, and API.
Shiny app [login]. Use shiny to allow users to explore portfolio returns based on different tolerances for risk.
Portfolio report [login]. Explore the same portfolio returns as the Shiny application above. The report generates a customized email for remote review by stakeholders and Connect stores the report history for review over time.
API [login]. Surface a function that computes the volatility of a stock price as a RESTful API. Connect automatically scales the number of R processes based on the volume of incoming API requests. Connect also contains a record of deployments, making it easy to roll back to a prior version of the API.